...and why you need to look at BOTH the aero drag of a wheel/tire combination AND the tire rolling resistance to help determine what is "fastest" (i.e. Low Crr can make up for a lot of aero "sins")
(
update 04/14/13: Added Michelin Pro4 Service Course to chart after roller testing. See chart and discussion below)
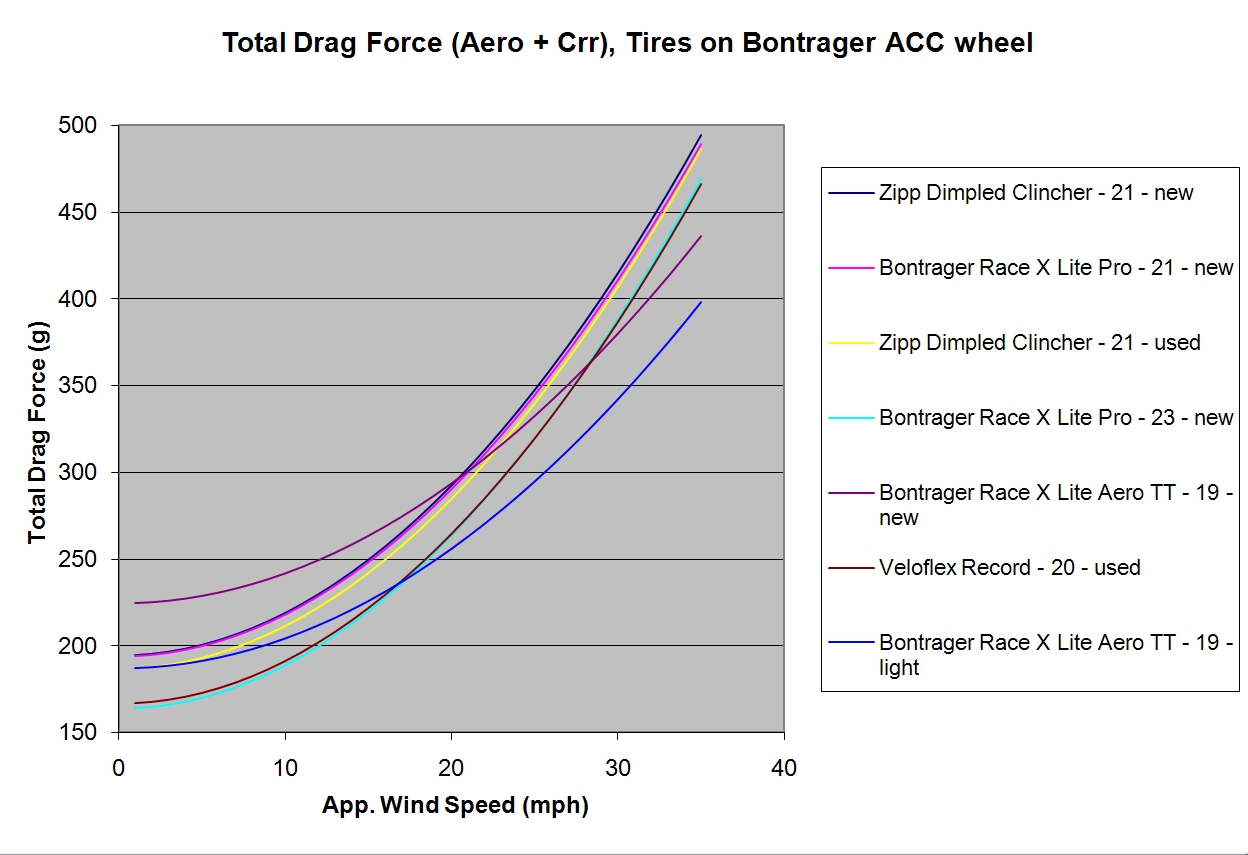
Five years ago, Damon Rinard (when he was working at Trek) made a post to the Slowtwitch triathlon forum where he described calculating a rough average of aero drag combined with rolling resistance. The data he used was from some wind tunnel testing he had done with various tires on the same rim (a Bontrager ACC - 50mm deep) and he combined this with the expected "on road" rolling resistance from roller testing. He did this because he found that different tires made a large difference in the aerodynamic drag of the wheel/tire system, and that simply choosing tires based on low rolling resistance OR low aero drag performance might not be the right approach.
I thought that was a neat approach and reverse engineered some of his data and expanded the idea to look at the effects of varying wind speed. In order to do so, I needed to scale the aero drag (taken at 30mph tunnel speed) to different apparent wind speeds using the ratio of V^2/(30mph^2) - since drag force varies with the square of wind velocity. That value was then summed with the rolling resistance force, which is constant, and then the total combined aero and rolling drag was plotted as a function of expected apparent wind speed.
Interestingly, when Trek/Bontrager released the R4 Aero tire a few years later (after Damon had left Trek to work for Vroomen/White Design) they included a plot very similar to the one I had created back in 2008:
To use that chart, you need to have an idea of what your general "race speed" is going to be and then figure out what the maximum apparent wind speed (i.e. the vector sum of the ambient wind speed at wheel level and the bike ground speed) you'll encounter. Then you can see what the average total force you'll be expecting from a particular combination. Now then, that's talking about the retarding force...if you want to know the power required for the different combinations, or the power differences between combinations, then you need to multiply the drag force value by the ground speed to get the rate of doing work (i.e. power) on that total drag force. Make sense?
One of the main takeaways from that exercise above I got was that looking at JUST aero drag or JUST Crr wasn't telling the whole story. It's very easy to "waste" a wheel/tire combination's low aero drag by using a slow rolling tire...and vice versa. But, the other takeaway I got is that really low Crr can "make up" for a lot of less than ideal aero drag performance
Well, for the plot above, the aero drag component was taken as just a simple average of the 5, 10, and 15 degree yaw angle drags. After seeing the plot below last fall (taken from the Mavic material given out at the CXR80 tire/wheel system introduction), I realized this type of estimate could be updated using a weighted average instead of a straight average. The weighting would be from the expected % time spent at each yaw angle. Obviously, we want to choose a combination based on it's performance under the conditions we expect to mostly see in our races. If we don't see large yaw angles very often, it might not be worth it to worry about differences in performance at those higher yaw angles between the equipment choices we are contemplating.

According to Mavic, the data taken above is from actual measurements (they built a "wind vane" type rig and attached it to a bike) from a large number of rides under varying conditons and courses. Although it may not represent the actual yaw angle distribution for any one particular ride (those will likely be skewed one direction or the other, depending on the course and conditions) but it does represent what one would expect over a large number of rides. As such, it should be a good tool for determining a good "all around" wheel/tire system choice.
Now then, what we need to update things further is some good aero data showing the drags at various yaw angles for different tire/wheel combinations. It would be really helpful if the data happened to be for tires which I've already roller tested and have an idea of the predicted "on road" Crr.
Well, we're in luck. The guys at Flo wheels went to the A2 tunnel last week and did just that on their new Flo30 wheel. They tested the Michelin Pro4 Service Course, the Conti GP4000S, the Bontrager R4 Aero, and the Vittoria Open Corsa EVO Tri. The last 2 were tires that I actually loaned them after Chris Thornham had contacted me asking if I knew of a good place to find the Bontrager tires. I happened to have a nearly new one handy and also offered to loan one of my Vittoria tires as well. Here's the blog post describing their tunnel visit and the aero data they took: Flo30 Aero

As can be seen in their data, the GP4000S was the clear winner aerodynamically, with the R4 Aero close behind it. The one tire that doesn't look too hot is the Vittoria. Although it stays fairly close to the other tires up to ~7.5 degrees of yaw angle, after that the drag goes way up. However, we know from my roller testing (
Crr chart) that it's Crr
is slightly lower than the other 2 tires, so it
might be able to make up for that, especially at lower yaw angles.
So, let's take a look. What is shown below is the result of taking a weighted average (using the Mavic probabilities for the weighting) of the drag values reported for the 3 tires that I have Crr data on (I'm working on getting a Michelin to roller test as well) combined with the Crr of each tire. I've used the values of Newtons for the drag force (since it's an
actual force unit, as opposed to grams) so that the drag force results can be simply multiplied by the expected ground speed (in meters/second) to quickly calculate the power (W). (If you want to convert the values to grams, then just divide by 9.81 m/s - gravity - and multiply by 1000)
(Note: the above chart assumes a wheel loading of 38kg and represents a single front wheel)
There's some interesting things going on in that chart. To understand what's going on there, it's helpful to realize that the "steepness" of each curve is controlled by the aero drag (it varies with the square of the wind velocity), while where the line sits vertically in the chart is controlled by the rolling resistance values (a constant force).
Despite the apparently poor showing of the Vittoria EVO Tri tire aerodynamically, at lower expected apparent wind speeds it actually performs slightly better than the other 2 tires shown; up until ~27 km/hr where it's curve crosses the GP4000S curve. As compared to the R4 Aero tire, that crossover doesn't happen until expected apparent wind speeds of ~35 km/hr. At the apparent wind speeds that I expect to see during my TT'ing (~45km/hr) the GP4000S is obviously the leader, with the R4 Aero in second, but the Vittoria still has a predicted
average combined drag force that's only .21N higher than the GP4000S. At the expected ground speed of ~42km/hr (i.e. 11.7 m/s), that results in a total power difference of just 2.5W. That's really not a very large amount, especially considering how much worse the Vittoria appeared to perform aerodynamically.
Now then, you might be asking "why is that?" Simply put, a lot of it has to do with the fact that the yaw angles where the largest differences in aero performance occur are also the yaw angles that are weighted less in the aero drag average due to their lower probability of being experienced. Another interesting thing is that the differences in Crr between the Vittoria tire and the other 2 isn't very large (all within .0004 of each other), but that's enough to overcome a seemingly significantly worse aero performance.
So far we've been talking about this subject in terms of races like TTs and triathlon bike legs where the front wheel is seeing "free air"...but, what about other types of bike racing? Well, when you're in a group and drafting, the apparent wind speed is going to be lower, along with the fact that the yaw angle distribution will narrow as well...and thus, that makes the Crr component all that more important. If you ever find yourself in the situation of riding up a false flat in a group while using poor rolling tires, you'll understand what I'm talking about here. Rolling resistance is actually a higher priority than wheel aerodynamics in road racing, in my humble opinion.
For one last plot, I took the data from the rest of the Flo wheels that were subsequently tested with the GP4000S tire. That plot is shown below, and as expected at lower expected apparent wind speeds, the wheels are closer together in performance than with higher expected apparent wind speed.
There we are...I hope that helps to understand some of the tradeoffs involved with choosing tires and wheels for cycling. Of course, there are other properties further involved in these sorts of tradeoffs, such as durability and "grip", but those other properties are tough to combine into a chart like the above...and so are left up to the user to weigh separately.
Update 04/14/13:
The guys at Flo were nice enough to send me the Michelin Pro4 Service Course tire used in the aero testing above and so I got a chance to run it on the rollers. The resultant Crr was .0043. They also sent the Continental GP4000S used in their testing and it rolled identically to my own version of that tire at .0034. Using that, I was able to update the Total Drag Force chart to include the Michelin on the Flo 30. The interesting thing about the curve for the Michelin is that despite it's aerodynamics being fairly close to the GP4000S and the Bontrager R4 Aero (especially with the yaw weighting) on the Total Drag Force chart it NEVER overcomes the "hit" it takes on rolling resistance, even out to expected apparent wind speeds of 60kph. Once again, the importance of Crr comes to the fore...